The short version
- Your store, GA4, Meta and Google Ads aren’t counting the same thing. Each one answers a different question.
- Ad platforms adding up to more sales than you actually had is normal. Each one gives itself credit.
- Some gaps are expected. A few mean something is broken. The trick is knowing which is which.
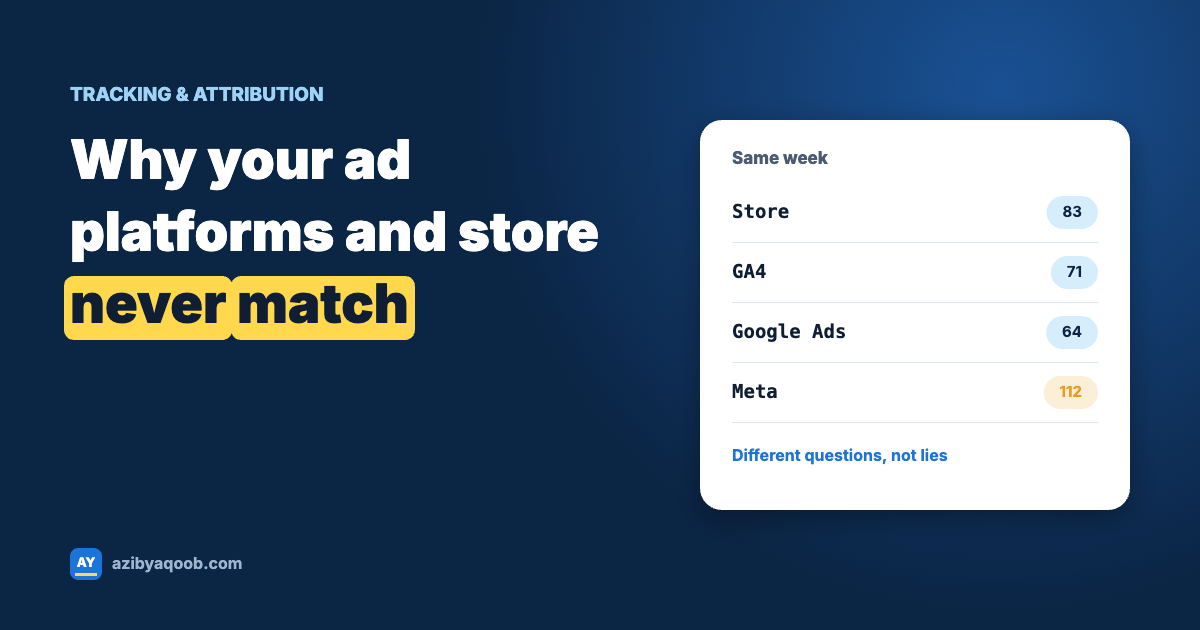
Imagine a normal week. Meta Ads Manager says your ads brought in 112 purchases. Google Ads says 64. GA4 says 71. Your store, the only system that actually took the money, recorded 83 orders.
The instinct is to ask which number is right. That’s the wrong question. A better one is: what is each tool actually counting? Once you see that, most of the confusion disappears, and the gaps that are left point you straight at the real problems.
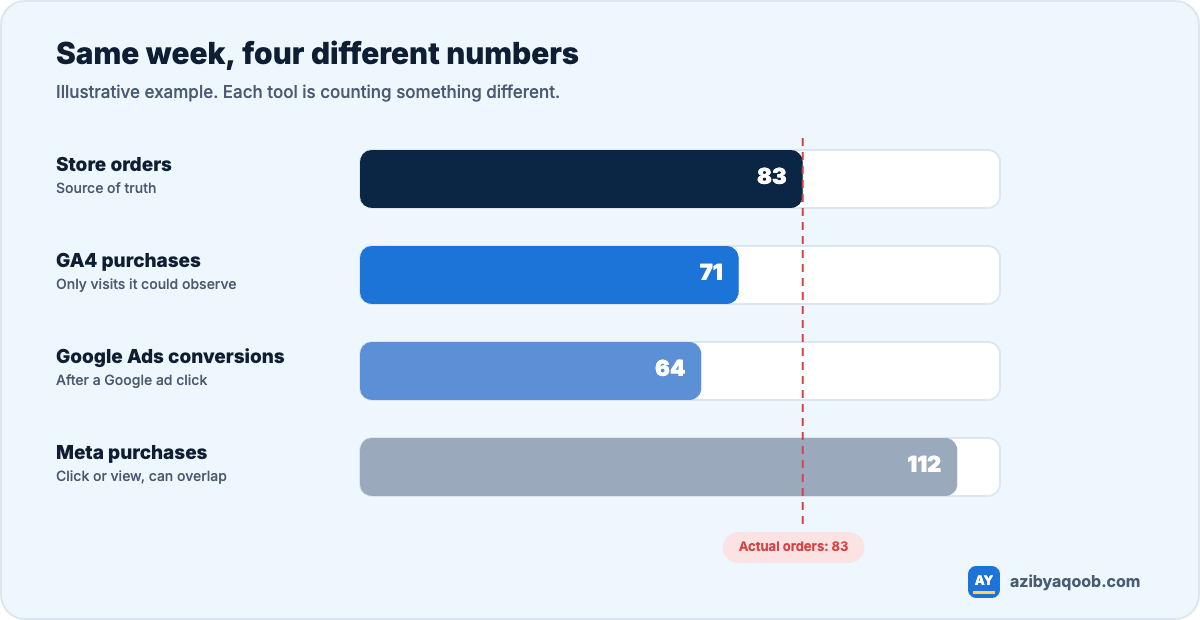
Table of Contents
Each tool answers a different question
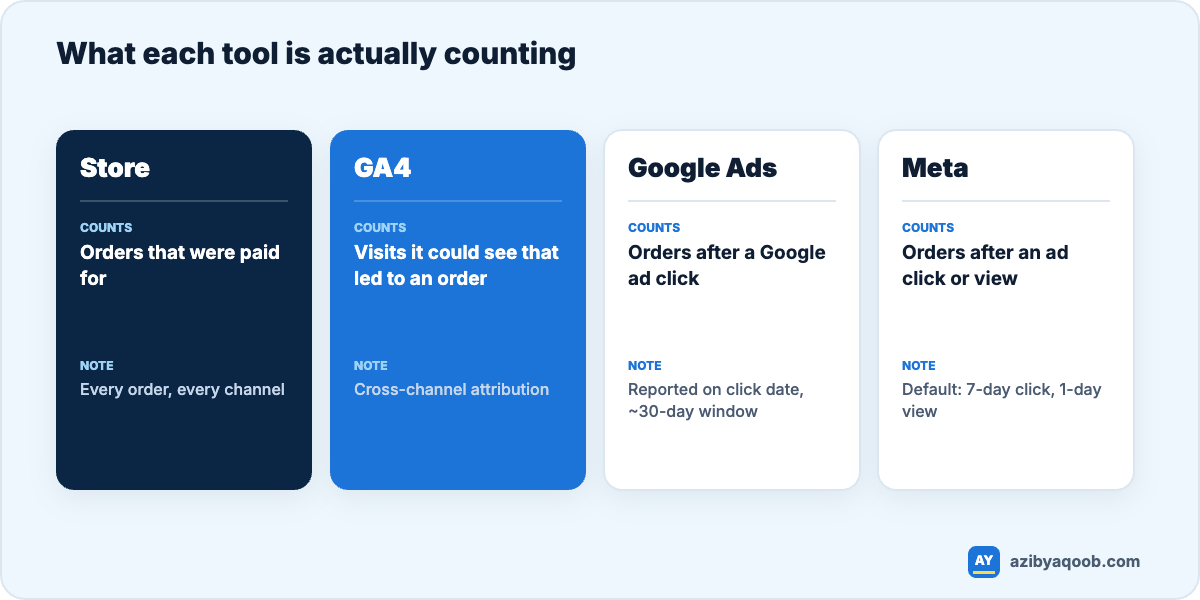
- Your store answers: how many orders were paid for? Every order, every device, every channel. This is your source of truth.
- GA4 answers: which visits that we could observe led to an order? It only sees visitors who didn’t block it and, in many regions, who accepted cookies.
- Google Ads answers: which orders happened after someone clicked one of our ads? It reports them on the date of the click, within its conversion window.
- Meta answers: which orders happened after someone clicked or saw one of our ads? By default that includes people who viewed an ad and bought within a day, without clicking.
Put that way, the 112 vs 83 above isn’t a contradiction. A customer who saw an Instagram ad on Monday, clicked a Google ad on Wednesday and bought on Thursday is claimed by both Meta and Google Ads. That’s not a bug. It’s how platform attribution works, and it’s why adding up your platforms almost always gives you more sales than you had.
My view: stop trying to make the platforms agree. Use your store for how much you sold, GA4 for which channels drove it, and each ad platform only for optimising its own campaigns. Arguments between those numbers usually come from using one tool to answer another tool’s question.
The normal reasons the numbers differ
1. Different attribution windows and models
Meta’s default is 7 days after a click and 1 day after a view. Google Ads commonly uses 30 days after a click. GA4 uses its own attribution model across all channels. Same customer, three different rules for who gets the credit.
2. Different dates
Google Ads and Meta report a conversion against the date of the ad interaction. Your store reports it on the order date. Look at “yesterday” in Google Ads and it will always look low, then fill in over the following days.
3. Privacy, consent and ad blockers
Some visitors block tracking scripts. Some decline cookies. Safari limits how long cookies last, so returning customers can look new. Every tool loses a slice of data this way, and each loses a slightly different slice.
4. Modelled conversions
Google and Meta both estimate conversions they can’t observe directly, using Consent Mode and their own modelling. That’s useful for optimisation, but it means their numbers are partly estimates, not a list of orders.
5. Different definitions of value
Your store’s revenue might include tax and shipping. Your GA4 purchase value might not. Your Meta purchase value might include them again. Agree one definition, for example product revenue after discounts, excluding tax and shipping, and use it everywhere.
The gaps that mean something is broken
These are the ones worth your time:
- GA4 shows more purchases than the store had orders. Purchases are being sent twice, usually by two apps or a pixel plus a tag manager.
- An ad platform’s purchases jump overnight with no change in sales. Usually a duplicate tag, or browser and server events that aren’t being deduplicated.
- GA4 drops suddenly to almost nothing. Something stopped firing: a theme change, a retired checkout script, an app update.
- Most GA4 purchases show as “(direct)” or “(not set)”. Attribution is breaking, often at the payment gateway or in a custom checkout pixel.
- Revenue in GA4 is consistently off by a fixed percentage. Usually tax, shipping or currency handled differently.
A rough guide to healthy gaps
| Comparison | Usually healthy | Worth investigating |
|---|---|---|
| GA4 purchases vs store orders | GA4 shows roughly 80–95% of orders | Below ~70%, or above 100% |
| Google Ads vs orders from Google Ads traffic | Within roughly 10–25% | Much lower, or higher than total orders |
| Meta vs store orders | Can be high because of view-through credit | More purchases than the store had in total |
| All platforms added together | Often more than 100% of orders | Not a useful test on its own |
These are rules of thumb, not standards. Consent rates, your audience and your sales channels all move them. What matters most is that the gap is stable. A gap that suddenly changes is a better alarm than any absolute number.
A 15-minute monthly check
- Export last month’s orders from your store. Note the order count and revenue using your agreed value definition.
- In GA4, look at purchases and revenue for the same dates and time zone. Note the percentage.
- In GA4’s traffic acquisition report, check what share of purchases sits in “(direct)” or “(not set)”.
- In each ad platform, check for sudden jumps or drops that don’t match your sales.
- Write the numbers down. Next month, compare the gaps, not just the totals.
If something jumps out, these guides go deeper: Shopify GA4 not tracking purchases, Meta Pixel vs Conversions API and Google Ads conversions not tracking on Shopify.
Want someone to check the gaps for you? A tracking audit compares your store, GA4 and ad platforms side by side and tells you which gaps are normal and which need fixing. See the tracking audit or ask for a free check.